What Actually Makes a YouTube Video Get Watched to the End

YouTube's own analytics don't score a video on how "engaging" it feels. They track four specific shapes on a line: flat, gradual decline, spike, and dip. Every editing decision that actually affects retention is really just a decision about which of those four shapes you're trying to produce at a given point in the video. Once you're reading the graph that way instead of chasing generic "hook the viewer" advice, editing for retention stops being a guessing game.
Quick reference: the four shapes
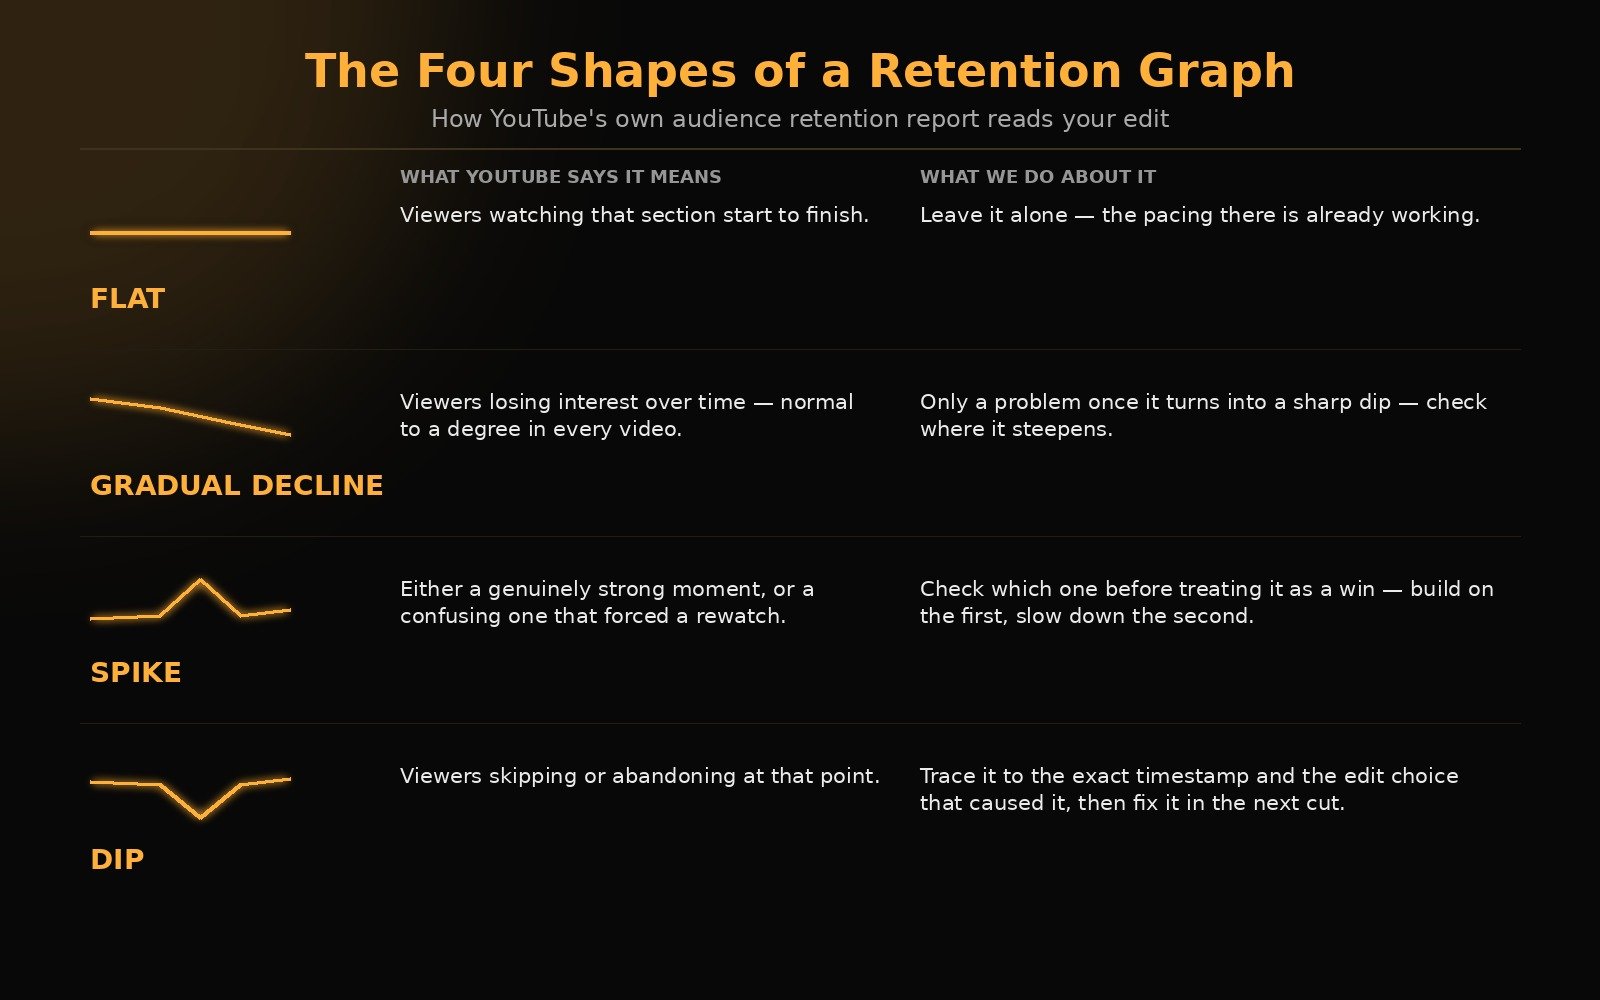
| Shape | What YouTube says it means | What we do about it |
|---|---|---|
| Flat | Viewers watching that section start to finish | Leave it alone; the pacing there is already working |
| Gradual decline | Viewers losing interest over time (normal to a degree in every video) | Only a problem once it turns into a sharp dip; check where it steepens |
| Spike | Either a genuinely strong moment, or a confusing one that forced a rewatch | Check which one it is before treating it as a win; build on the first, slow down the second |
| Dip | Viewers skipping or abandoning at that point | Trace it to the exact timestamp and the specific edit choice that caused it, then fix that in the next cut |
What YouTube itself says retention actually measures
According to YouTube's own Help Center documentation, the audience retention report highlights four types of moments: flat sections (viewers watching start to finish), gradual declines (viewers losing interest over time, normal to some degree in every video), spikes (moments getting rewatched or shared), and dips (moments getting skipped or abandoned).
The part most creators miss is buried in YouTube's own description of what a spike means: it can mean your content resonated or it can mean "your content isn't clear and your audience had to rewatch a section." Same shape on the graph, opposite diagnosis. Reading a retention graph correctly means knowing which one you're looking at, not just celebrating any upward bump.
YouTube's official blog makes a related point that changes how you should diagnose a video that isn't performing: retention and click-through rate measure two different failures. High CTR with low retention doesn't mean your video needs a better hook. It means your thumbnail and title promised something the first seconds of the video didn't deliver. That's a mismatch problem, not a pacing problem, and editors who treat it as a pacing problem end up cutting the wrong thing.
The intro window: what "flat" actually requires
YouTube's retention report has a specific metric called Intro: the percentage of viewers still watching after the first 30 seconds. Per YouTube's own guidance, a strong intro percentage means the first 30 seconds matched what the thumbnail and title promised, and the content held interest immediately.
What that means on the timeline, practically: no slow builds, no channel intro before the payoff, no context-setting before the viewer sees the thing they clicked for. If the thumbnail shows a result, the edit needs to earn its way toward showing that result fast, or open on it and work backward. This is the single most common fix we make on a first draft: moving the strongest visual moment from wherever it naturally falls in the raw footage to the first cut a viewer sees.
The middle: where gradual decline turns into a dip
YouTube's documentation notes that some decline over a video's runtime is normal, audiences naturally taper off. The editing problem isn't the decline itself, it's when a gradual decline turns into a sharp dip at a specific, identifiable point. That's where the retention graph becomes a genuinely useful editing tool, because a dip points at an exact timestamp instead of a vague "the middle felt slow" note.
The moments that turn into dips in practice, from what we see across projects, aren't usually the moments creators expect. It's rarely the "boring topic" section. It's almost always a specific edit choice: a jump cut that breaks continuity awkwardly instead of tightening it, a piece of context repeated after the viewer already has it, or a visual that stays on screen a beat longer than the information it's conveying. None of that shows up by watching the cut once. It shows up by matching the retention graph against the timeline, timestamp by timestamp, after the video is live, and then applying what you find to the next edit.
Spikes are a diagnostic, not just a win
This is the part most "retention tips" content skips entirely, because YouTube's own documentation is explicit that a spike can be a warning sign. If a spike lines up with a genuinely strong moment (a punchline, a reveal, a payoff), that's a segment worth building more of. If a spike lines up with a rushed explanation or a piece of information delivered too fast to catch the first time, that's a pacing problem wearing a retention win's clothes. The fix in the second case isn't more of that moment. It's slowing that exact moment down next time.
A pattern that's held up across real projects
One pattern that's held up across real projects: for one of our home-maintenance ("how-to house") clients, the edit opens directly on the viewer's specific problem rather than a channel intro or any setup. The full list of possible solutions never gets shown up front, it stays back-loaded so there's a reason to keep watching. The last solution gets teased early as the easiest or most effective one, which is what actually holds attention through the middle instead of losing it to a gradual decline. Each solution chains directly into the next, one leads into the reason the next one matters, instead of resetting the viewer's attention with a hard cut between unrelated tips. That structure is what turns "flat" from a lucky accident into something repeatable on the next video in the same format.
What this actually means for the edit, not just the analysis
Reading a retention graph well doesn't help if it only happens after publish. The practitioner version of this is building the habit into the edit itself:
- Structure the first 30 seconds around the thumbnail's promise, not the chronological start of the footage.
- Treat every jump cut as a decision, not a default. A jump cut that removes dead air helps; one that breaks a visual continuity the viewer was tracking creates exactly the kind of confusion YouTube's own documentation flags as a false-positive spike.
- After a video is live, pull up the retention graph specifically to find dips at exact timestamps, and treat each one as a note for the next edit in that format, not just that video.
- Use genuine spikes (the good kind) as the source material for shorts and trailers, since a moment that already held attention once is the safest bet for holding it again in a shorter cut.
FAQ
What's a good retention rate on YouTube? YouTube doesn't publish one universal number, and treating any single percentage as a target is misleading. Retention varies heavily by video length and niche. YouTube's own Studio tools point creators toward comparing a video against their own last 10 videos of similar length rather than an external benchmark, which is the more useful comparison in practice.
Does a high click-through rate mean a video will retain well? Not necessarily, per YouTube's own guidance. CTR and retention diagnose different problems. A high CTR with low retention usually points to a mismatch between what the thumbnail/title promised and what the first seconds of the video deliver, not a weak hook.
What causes a spike in a retention graph? Either a genuinely strong moment that got rewatched or shared, or a confusing moment that forced viewers to rewatch it to understand. YouTube's own documentation lists both as possible causes of the same shape, so a spike needs a second look before treating it as a win.
What's the most common retention mistake editors make? Diagnosing a slow section correctly is the harder part, but the fix side is usually simpler than it looks: dips tend to trace back to a specific edit choice at an exact timestamp (a jump cut, a repeated point, a visual held too long), not a vague "this part is boring" problem.
The retention graph is the closest thing to a second opinion an editor gets on their own cut, but reading it well only pays off if there's a real process behind the edit itself, not just a talented eye. That process is what we walk through in Inside Our AI-Enhanced Editing Workflow, brief to final cut, tools included. If you want that same judgment applied to your channel, that's what the first call is for.
Want Your Content Edited Like This?
Hand off the editing and keep the creative direction. EDITRS handles the rest.